What is The K-Shaped Economy
How the Pandemic Revealed — and Widened — the Great Economic Divide
When the COVID-19 pandemic swept through the global economy in 2020, it did not hit everyone equally. While some workers shifted seamlessly to home offices and watched their investment portfolios grow, others lost jobs overnight, fell behind on rent, and faced an uncertain road to recovery. Out of this stark divergence came a concept that has since reshaped how economists, policymakers, and business leaders talk about inequality: the K-shaped economy.
The K-shape describes an economic trajectory in which two segments of the population move in opposite directions following a shock. One group recovers quickly and even thrives — the upward arm of the K. Another continues to decline or stagnate — the downward arm. The resulting split is not a temporary blip but a reflection of deep, structural fault lines in modern economies that the pandemic made impossible to ignore.
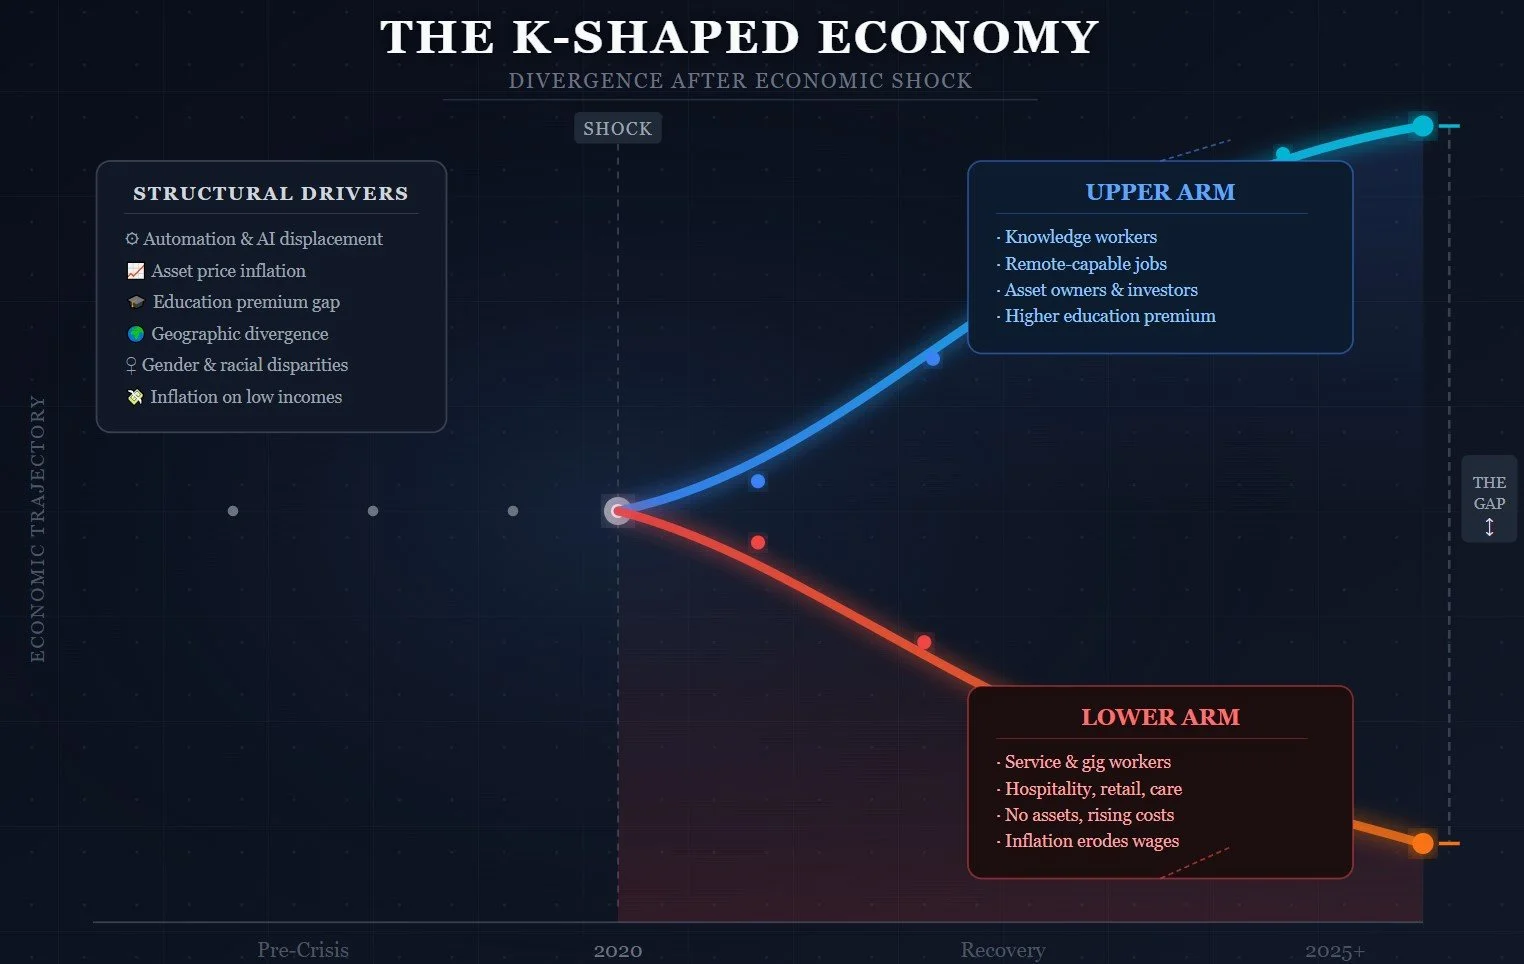
K - Shape economy illustration
What Does K-Shaped Mean?
Traditional economic recoveries are described with single letters. A V-shaped recovery is sharp and symmetrical — a steep fall followed by a steep rise. A U-shape is more prolonged. An L-shape signals a protracted depression with no meaningful rebound. The K adds a new dimension: it captures divergence rather than a single trajectory.
In a K-shaped recovery, the aggregate economic data can look deceptively healthy. GDP may rebound, unemployment may fall, and markets may soar — all while a significant portion of the population is still struggling. The top line numbers mask what is happening underneath: two entirely different economic realities coexisting within the same national economy.
The concept is not entirely new — economists have long studied bifurcated labor markets and wealth inequality — but the pandemic gave it a name that stuck, because the divergence was sudden, dramatic, and visible in real time.
Who Goes Up, Who Goes Down
The upper arm of the K is largely occupied by higher-income, college-educated workers in knowledge-based industries: technology, finance, consulting, law, and healthcare administration. These workers could shift to remote work with minimal disruption. Many actually reduced spending on commuting, travel, and dining out, leading to higher savings rates. Meanwhile, their asset portfolios — stocks, real estate, retirement funds — appreciated sharply as central banks cut interest rates and injected liquidity into financial markets.
The lower arm tells a different story. Workers in hospitality, food service, retail, personal care, and physical labor could not take their jobs home. When businesses shuttered, their incomes disappeared. These workers tended to have fewer savings to fall back on, less access to credit, and greater exposure to health risks from the virus itself. Even as economies reopened, many faced reduced hours, sector contraction, and the psychological and financial toll of prolonged uncertainty.
The result was a widening gap not just in income but in wealth, health outcomes, and long-term economic prospects.
The Structural Forces at Work
To understand the K-shaped economy, you have to look beyond the pandemic. The divergence did not appear from nowhere in 2020; it accelerated trends that had been building for decades.
Automation and technological displacement have steadily eroded middle-skill, middle-income jobs — a phenomenon known as labor market polarization. Routine tasks, whether in manufacturing or back-office administration, have been increasingly taken over by machines and software. What remains is a barbell-shaped labor market: high-skill jobs at the top that command premium wages, and low-skill service jobs at the bottom that do not.
The education premium has also widened. The earnings gap between those with and without a college degree has grown consistently over the past 40 years in most developed economies. This is not merely about credentials — it reflects the genuine shift in what the economy demands.
Perhaps most significantly, the wealth effect of low interest rates and quantitative easing has disproportionately benefited asset holders. When central banks suppressed rates to support growth, asset prices — stocks, bonds, real estate — rose sharply. Those who already owned these assets grew richer. Those who did not own them were priced further out of the market, particularly in housing, which remains the primary vehicle of wealth-building for middle-class families.
The Policy Debate: Did Stimulus Help or Hurt?
The policy response to the pandemic-era K-shape sparked a fierce debate that continues today. Governments deployed massive fiscal stimulus — direct payments, enhanced unemployment benefits, small business loans — while central banks kept rates near zero and expanded their balance sheets to historic levels.
Proponents argue that without these interventions, the lower arm of the K would have fallen far more sharply. Targeted relief programs cushioned the blow for millions of workers and small businesses, and the rapid labor market recovery in many countries was largely attributed to aggressive policy support. In the United States, for instance, the child poverty rate fell to a historic low in 2021, driven by expanded tax credits.
Critics, however, point to unintended consequences. Low interest rates and asset purchases inflated prices for stocks and real estate, handing enormous gains to those who already owned wealth. The subsequent inflation surge of 2021 to 2023 — driven partly by supply shocks and partly by the scale of monetary stimulus — eroded real wages for low-income workers, who spend a higher share of income on necessities like food, energy, and housing.
The honest assessment is that policy both helped and complicated the K-shape simultaneously. Direct income support softened the lower arm; monetary policy inflated the upper one.
Inflation's Cruel Twist
The inflation wave that followed the pandemic added a cruel dimension to the K-shaped narrative. Headline inflation hit 40-year highs in the United States and Europe in 2022, driven by supply chain disruptions, energy shocks from the war in Ukraine, and the lagged effects of excess demand.
For those on the upper arm, inflation was manageable. Higher earners held real assets — homes, stocks — that tend to appreciate with inflation. For those on the lower arm, the effect was devastating. Low-income households spend a much larger proportion of their budgets on food, energy, and rent — precisely the categories where price increases were most acute. Even modest nominal wage growth was wiped out by the cost of living. The lower arm of the K bent even further downward.
Is the K a Permanent Fixture?
A central question for policymakers and economists is whether the K-shaped pattern is a cyclical response to an unusual shock or a permanent feature of modern economies.
The evidence is sobering. The structural forces driving the K — technological displacement, the education premium, asset inflation — were present long before COVID-19 and show no sign of reversing. If anything, the rapid advance of artificial intelligence is set to accelerate the hollowing out of middle-skill work, potentially pushing more workers toward the lower arm.
That said, mobility between arms is possible and matters enormously. If workers on the lower arm can access education, retraining, and upskilling opportunities, the long-term picture looks more dynamic. Investments in affordable housing, childcare, and public transportation can reduce the structural barriers that keep lower-income workers trapped. Some European countries with stronger social safety nets and active labor market policies have managed more equitable recoveries, suggesting that the shape of the K is not entirely inevitable.
The K-shape also has a generational dimension. Younger workers and recent graduates who entered the labor market during or after the pandemic faced a peculiar set of disadvantages — difficulty building experience, disrupted professional networks, inflated housing markets that make wealth accumulation harder. Whether this generation can close the gap remains an open question.
A Note on Limitations
It is worth noting that the K-shaped economy is a metaphor, not a formal economic model. Some economists push back on its imprecision, arguing that income distributions are more complex than a binary split suggests. Recoveries are gradual and heterogeneous; the K simplifies a messy reality.
That critique is valid, but it does not diminish the concept's usefulness as a lens for understanding inequality. The K-shape forces us to look beyond aggregate statistics and ask who, exactly, is benefiting from economic growth — and who is being left behind.
Conclusion: An X-Ray of Pre-Existing Inequality
The K-shaped economy did not emerge fully formed from the pandemic. COVID-19 was an accelerant, not an origin. The divergence it made visible had been building for decades through the forces of technological change, globalization, financialization, and the erosion of labor market institutions that once compressed inequality.
What the pandemic did was strip away the ambiguity. When the shock hit, it sorted people almost immediately into those with enough cushion — financial, educational, professional — to weather it and those without. The K became visible to a public audience that had grown comfortable with headline unemployment rates and rising GDP numbers that obscured the divergence beneath.
The most important lesson of the K-shaped economy may be this: aggregate growth is necessary but not sufficient. An economy can expand while leaving large portions of its population further behind. Unless policymakers design interventions that specifically address the structural drivers of divergence — and unless businesses, investors, and civil society engage with the question of who benefits from growth — the arms of the K will continue to drift apart.
The shape of the recovery matters. So does the shape of the economy we are trying to recover toward.
This content represents the views and perspectives of Alfred Vault and is provided for informational and educational purposes only. It does not constitute investment advice. Please refer to our full disclaimer.